Keeping chemistry on farm – the immediate challenges
8 July 2025AUSVEG emphasises staying safe ahead of National Farm Safety Week
18 July 2025Input costs and trends
As 2025 hits the halfway mark the cost of inputs, ranging from employment to fertiliser and chemicals have been clearly shown to be at the mercy of events at home and overseas. Overseas concerns range from the uncertainty about the actions of US President Donald Trump and how they may directly or indirectly impact Australia’s export markets. Also the conflicts in the Middle East and Ukraine.
A bit closer to home wage and superannuation costs have increased, while the weather has been mixed. In some areas there’s been flooding and near cyclonic conditions. In others a drought which seems to have no end.
As 1 July ticked over, the Fair Work Commission’s latest increase to the National Minimum Wage and modern award rates of 3.5 percent came into effect. The superannuation guarantee also increased from 11.5 percent to 12 percent.
While not unexpected, and not as high as the 4.5 percent called for by the ACTU, it’s still another increase growers have to deal with.
With the last AUSVEG Sentiment Report finding that labour costs, are on average, 41% of production costs, and up to 70% of costs in more labour-intensive systems, this increase will put further pressure on margin squeeze.
At the same time, input prices have bounced around alarmingly due to the unrest in the Middle East. The significant and immediate impact that the conflict between Israel and Iran has had on Australian fuel and fertiliser prices are a clear illustration of Australia’s dependence on fragile global supply chains, and the value of local production wherever possible.
There are some glimmers of hope that exposure may be lessened in time, at least for fertilisers, as you can read below. In a previous edition of the pricing and inputs update, we looked at the struggles of Australian urea projects to get off the ground. This time we look at several phosphate projects, where the picture looks more promising.
In an increasingly uncertain global trade environment, it would certainly be a positive step for Australia’s food security if our growers could enjoy the same local supply chains as the country’s vegetable consumers.
Don’t forget to tell us how these issues are affecting your business. AUSVEG’s July 2025 Industry Sentiment Survey has recently been released. Make sure you have your say here to ensure the most urgent issues facing our sector are heard loud and clear as Parliament resumes on 22 July.
Fertiliser
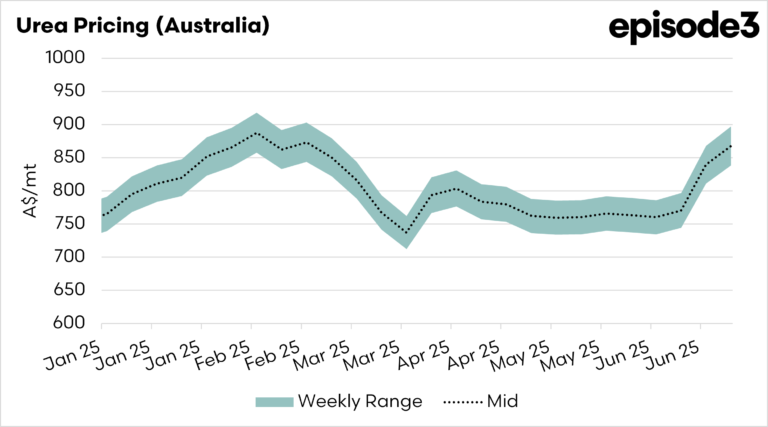
Urea prices have shot up in recent weeks due to the hostilities between Israel and Iran. Egypt halted urea production on 13 June after Israel, which supplies Egypt’s natural gas feedstock, froze operations at its offshore gas fields due to risks from Iranian missile strikes.
Similarly, Iran’s seven urea plants were idled due to Israeli strikes. Egypt and Iran collectively accounted for almost 20 percent of global urea trade last year.
Production in both countries resumed following the shaky ceasefire, however, which has started to bring prices back down, albeit still well above pre-conflict levels.
Iranian threats to close the Strait of Hormuz are also a major concern. Closure of the Strait would severely restrict more than 40 percent of global offshore urea trade from producers in Qatar, UAE, Bahrain, Saudi Arabia and Egypt. Even if the Strait isn’t closed, it appears likely that insurance premiums for shipping in the region will rise, which will no doubt flow through to landed urea pricing.
More than half of Australia’s urea imports come from the Middle East, according to commodity analyst Argus Media, meaning supply disruptions there have a rapid impact on domestic pricing.
For phosphates, global DAP and MAP prices have also risen, driven by tight global supply, firm seasonal demand and rising freight costs.
Australia currently imports around 88 percent of its phosphate requirements, meaning all those global disruptions have a direct impact on local pricing. That may change in future, however, with a number of major phosphate projects progressing in northern Australia:
- Verdant Minerals’ Ammaroo project: recently granted two mining leases in the NT, and given ‘major project’ status by the Federal Government last year, the project aims to tap into one of the world’s largest undeveloped phosphate resources. Verdant Minerals plans to build processing capacity to produce around 1M tonnes of ammonium phosphate fertilisers per annum. The project still has several approval and finance hurdles to jump.
- North West Phosphate’s Paradise South project: given priority status by the Queensland Government last month, the Paradise South project is expected to mine up to 2M tonnes of phosphate ore per annum, and will process the ore into phosphate concentrate.
On the other side of the ledger, however, Dyno Nobel (formerly Incitec Pivot) is undertaking a strategic review of its Phosphate Hill facility due to the rising cost of gas. Phosphate Hill is expected to produce 740,000-800,000 tonnes of MAP and DAP fertilisers in FY2025, and has been the major domestic supplier of phosphate fertilisers for many years.
Urea pricing (Australia) Jan 2025 to June 2025 (AUD)
Source: Episode3
Diesel
Diesel pricing had enjoyed a slow but steady easing for the first half of this year, but the recent conflict between Israel and Iran has sent oil prices, and thus diesel, into a spin over the past few weeks.
The brent crude oil price jumped from US$69.36 a barrel on 12 June, prior to the conflict, to US$79 on 23 June.
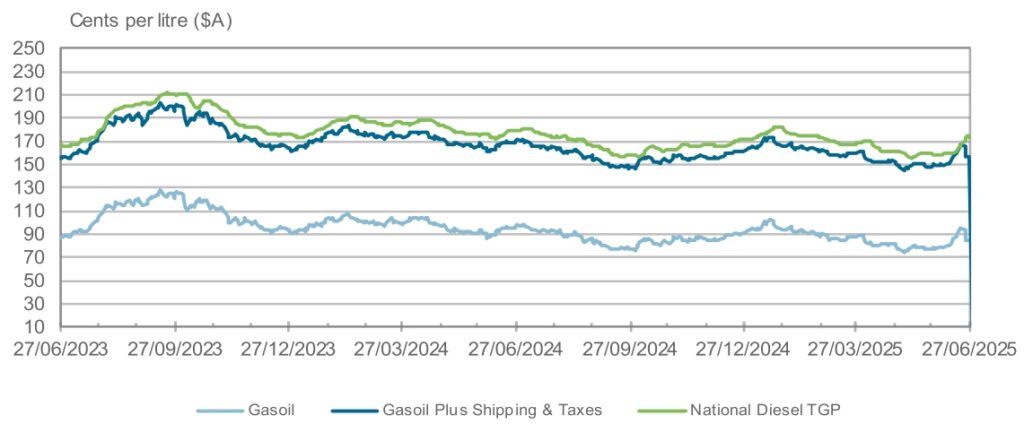
Following the ceasefire between the two countries, however, pricing has come back down. You can see in the most recent weeks in the chart below how responsive Australian diesel pricing has been to these disruptions, so the outlook over the next few months is essentially dependent on political developments in the Middle East.
The graph below shows Australian wholesale diesel prices (National Diesel TGP) against the Singapore wholesale price (Gasoil).
Australia imports almost 70 percent of diesel, predominantly from Asia, and Gasoil sets the price benchmark for Australia. A prediction of Australian diesel prices can be found by following the Singapore Gasoil price; Australian pricing lags 1-2 weeks behind. You can follow the Australian Institute of Petroleum’s diesel price reports here.
Australian wholesale diesel price (TGP) vs Singapore diesel price (Gasoil) June 2023 to June 2025
Source: Australian Institute of Petroleum
Energy
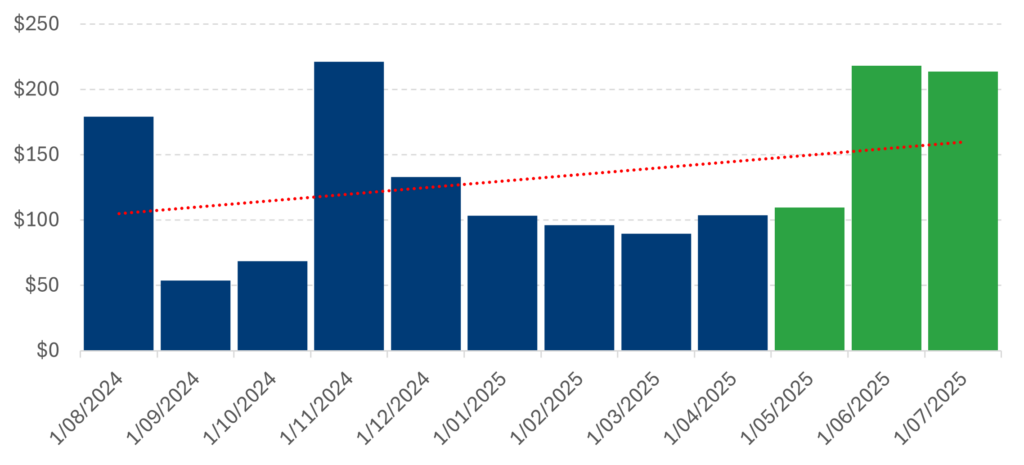
Following six months of price relief, wholesale electricity costs jumped again in June, and are staying at similar levels heading into July.
Average June spot prices were the second highest in history for that month, after June 2022. There are a few factors behind the spike:
- Low hydropower generation due to Snowy Hydro water shortages.
- ‘Triple C Day’ crisis – a cold, calm and cloudy day on 26 June that reduced wind and solar generation, but drove peak heating demand, shooting spot prices to ‘extreme’ levels.
- The continuing outage of five major coal generators.
Increased costly gas generation to close the gap.
National Energy Market Volume Weighted Price ($/MWh)
Source: Open Electricity
Retail market data
CPI
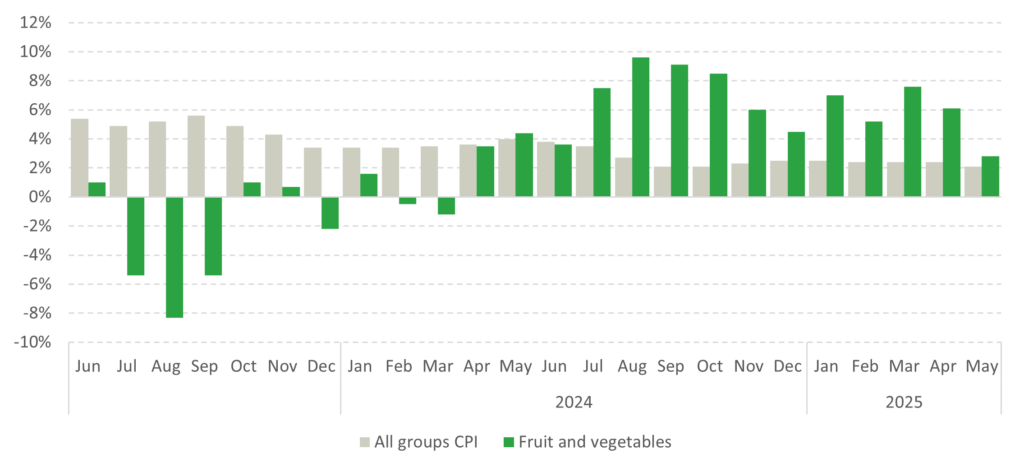
The monthly Consumer Price Index (CPI) indicator was at 2.1 percent in May, only a small drop from the previous month.
Fruit and vegetable CPI dropped significantly, however, from 6.1 percent in April to 2.8 percent in May. The ABS attributes this primarily to a drop in fruit prices, particularly mandarins, oranges, avocados and apples.
The graph below shows the Australian Bureau of Statistics (ABS) monthly CPI indicator for fruit and vegetables, which represents each month’s percentage change on the same month the year before.
Monthly CPI Indicator – fruit & veg vs all groups
2023-2025
Source: ABS
Retail sales
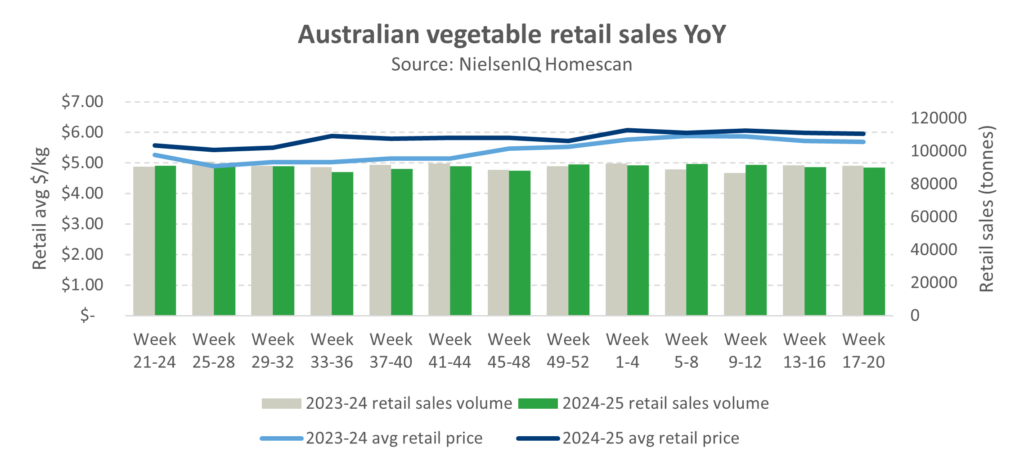
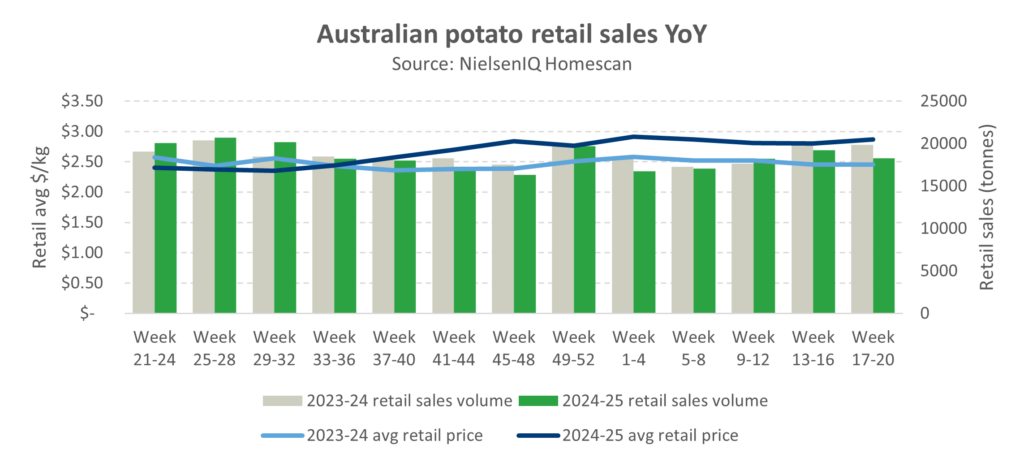
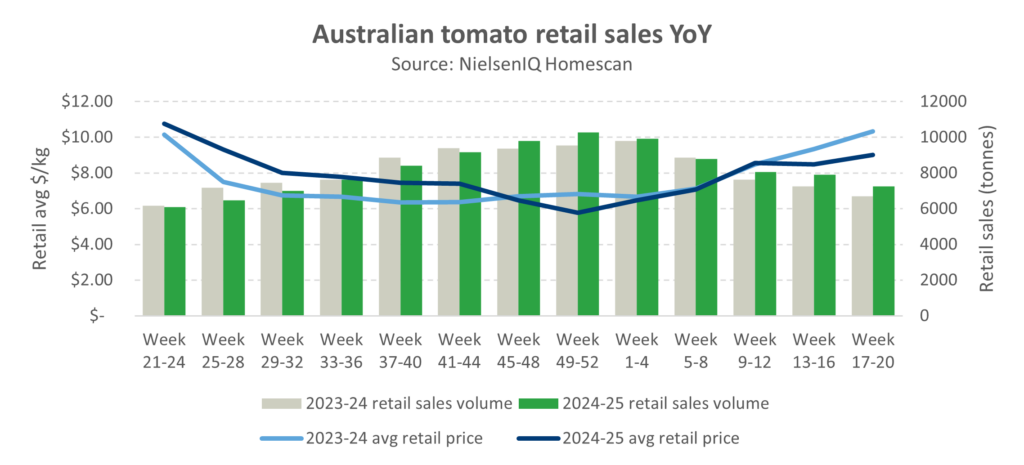
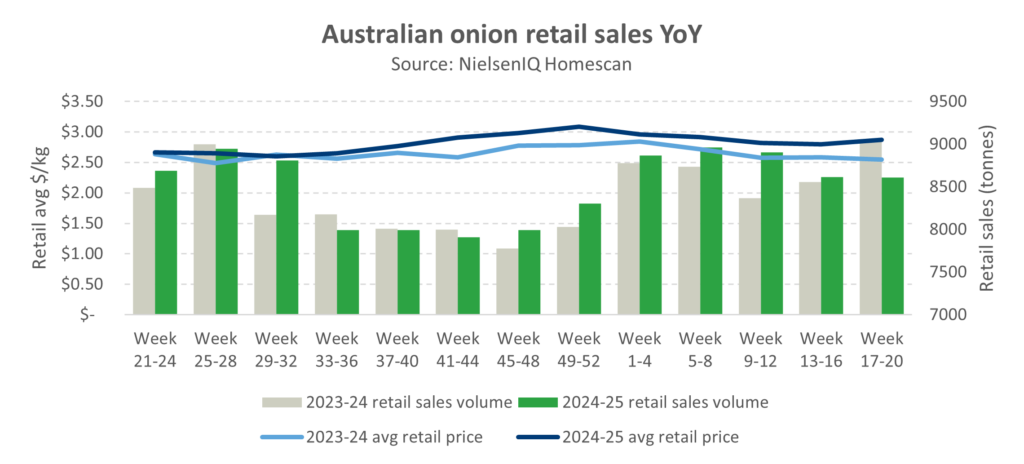
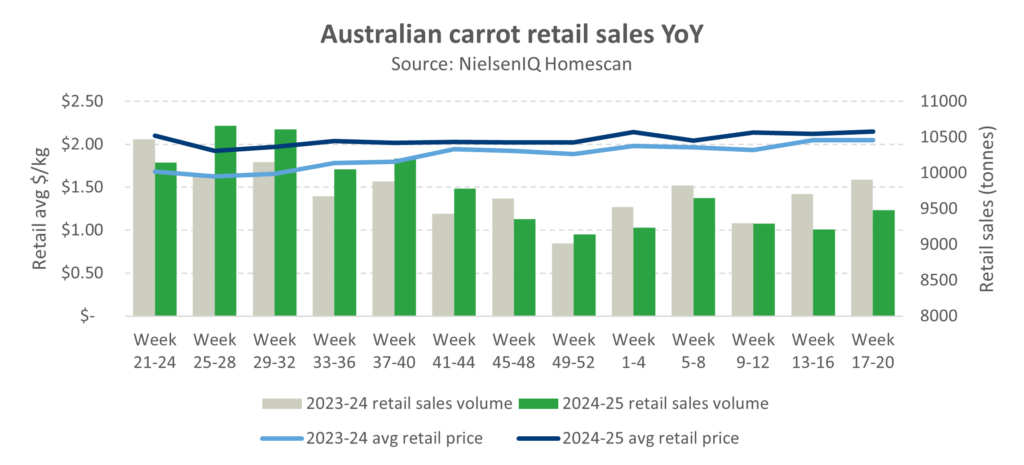
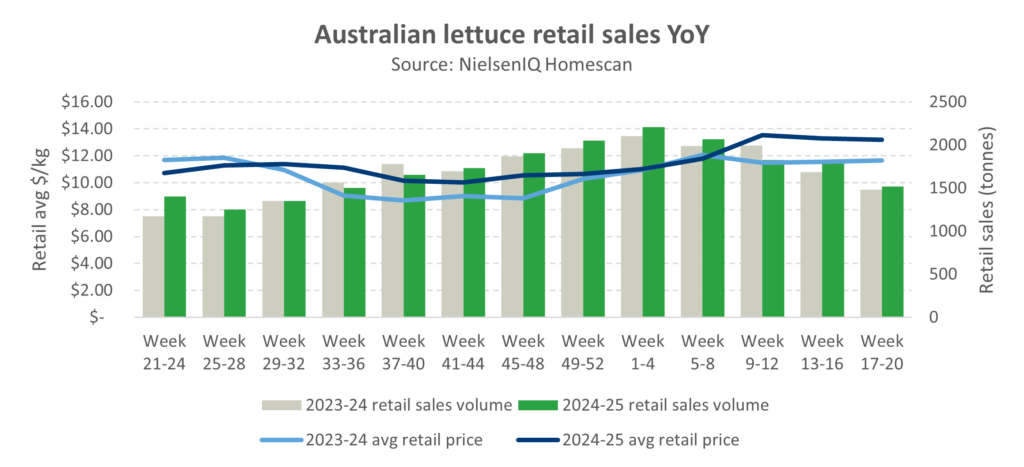
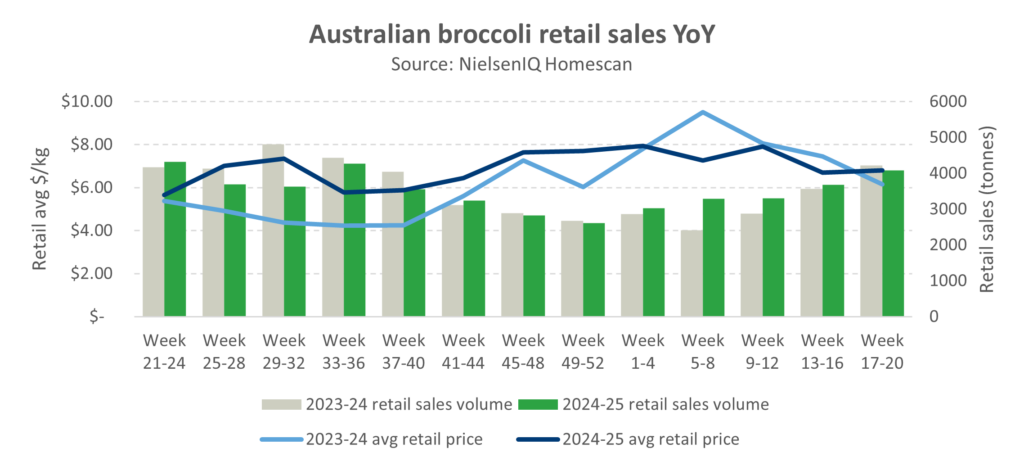
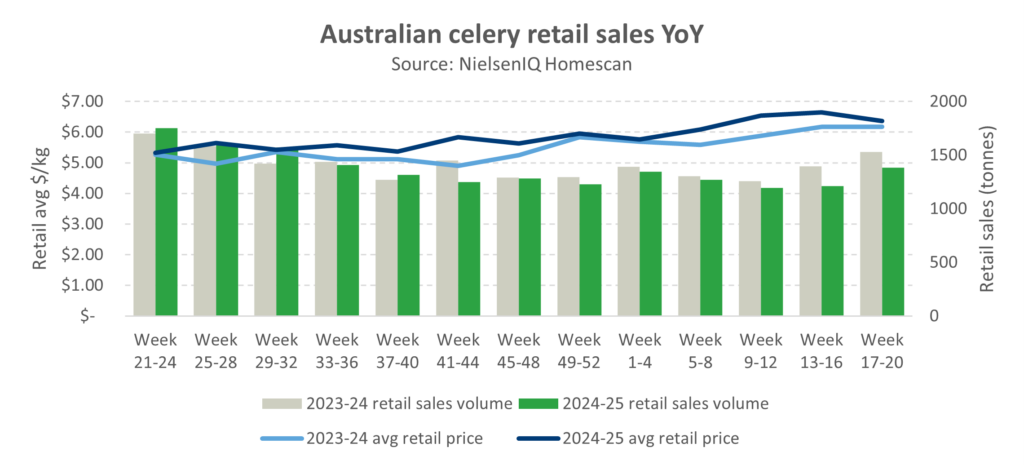
The charts below show NielsenIQ Homescan data for potatoes, onions, carrots, lettuce, broccoli and celery, provided through Hort Innovation’s levy-funded Consumer purchase and retail data (MT21004) program.
The data is presented in four-week periods, with the below period ending on 18 May 2025.
Average monthly vegetable retail prices so far this year have stayed above those 12 months prior, but by a lower margin than the second half of 2024. Average monthly total vegetable retail prices were 4 percent higher YoY, whereas prices in the last six months of 2024 were 10 percent higher.
Retail sales volume has also been resilient, tracking very close to the same period in the previous year. In fact, total vegetable retail sales volume is only 0.2 percent lower YoY over the past 12 months, despite prices being 7.2 percent higher. That’s generated an additional $457m in retail sales, according to Nielsen’s figures.
These results have played out across all the major vegetable categories. Celery and tomatoes had slower retail growth with total retail sales increasing by only 3.4 percent and 3.8 percent respectively. Fresh tomato supply has been disrupted due to the Tomato Brown Rugose virus, and this has affected price and volume.
The high performers have been broccoli, at 13.1 percent, lettuce at 10.5 percent, and carrots at 10.4 percent YoY growth in retail sales value.
