


AUSVEG Advocacy: European horticulture workforce insights from ATMAC study tour
31 October 2023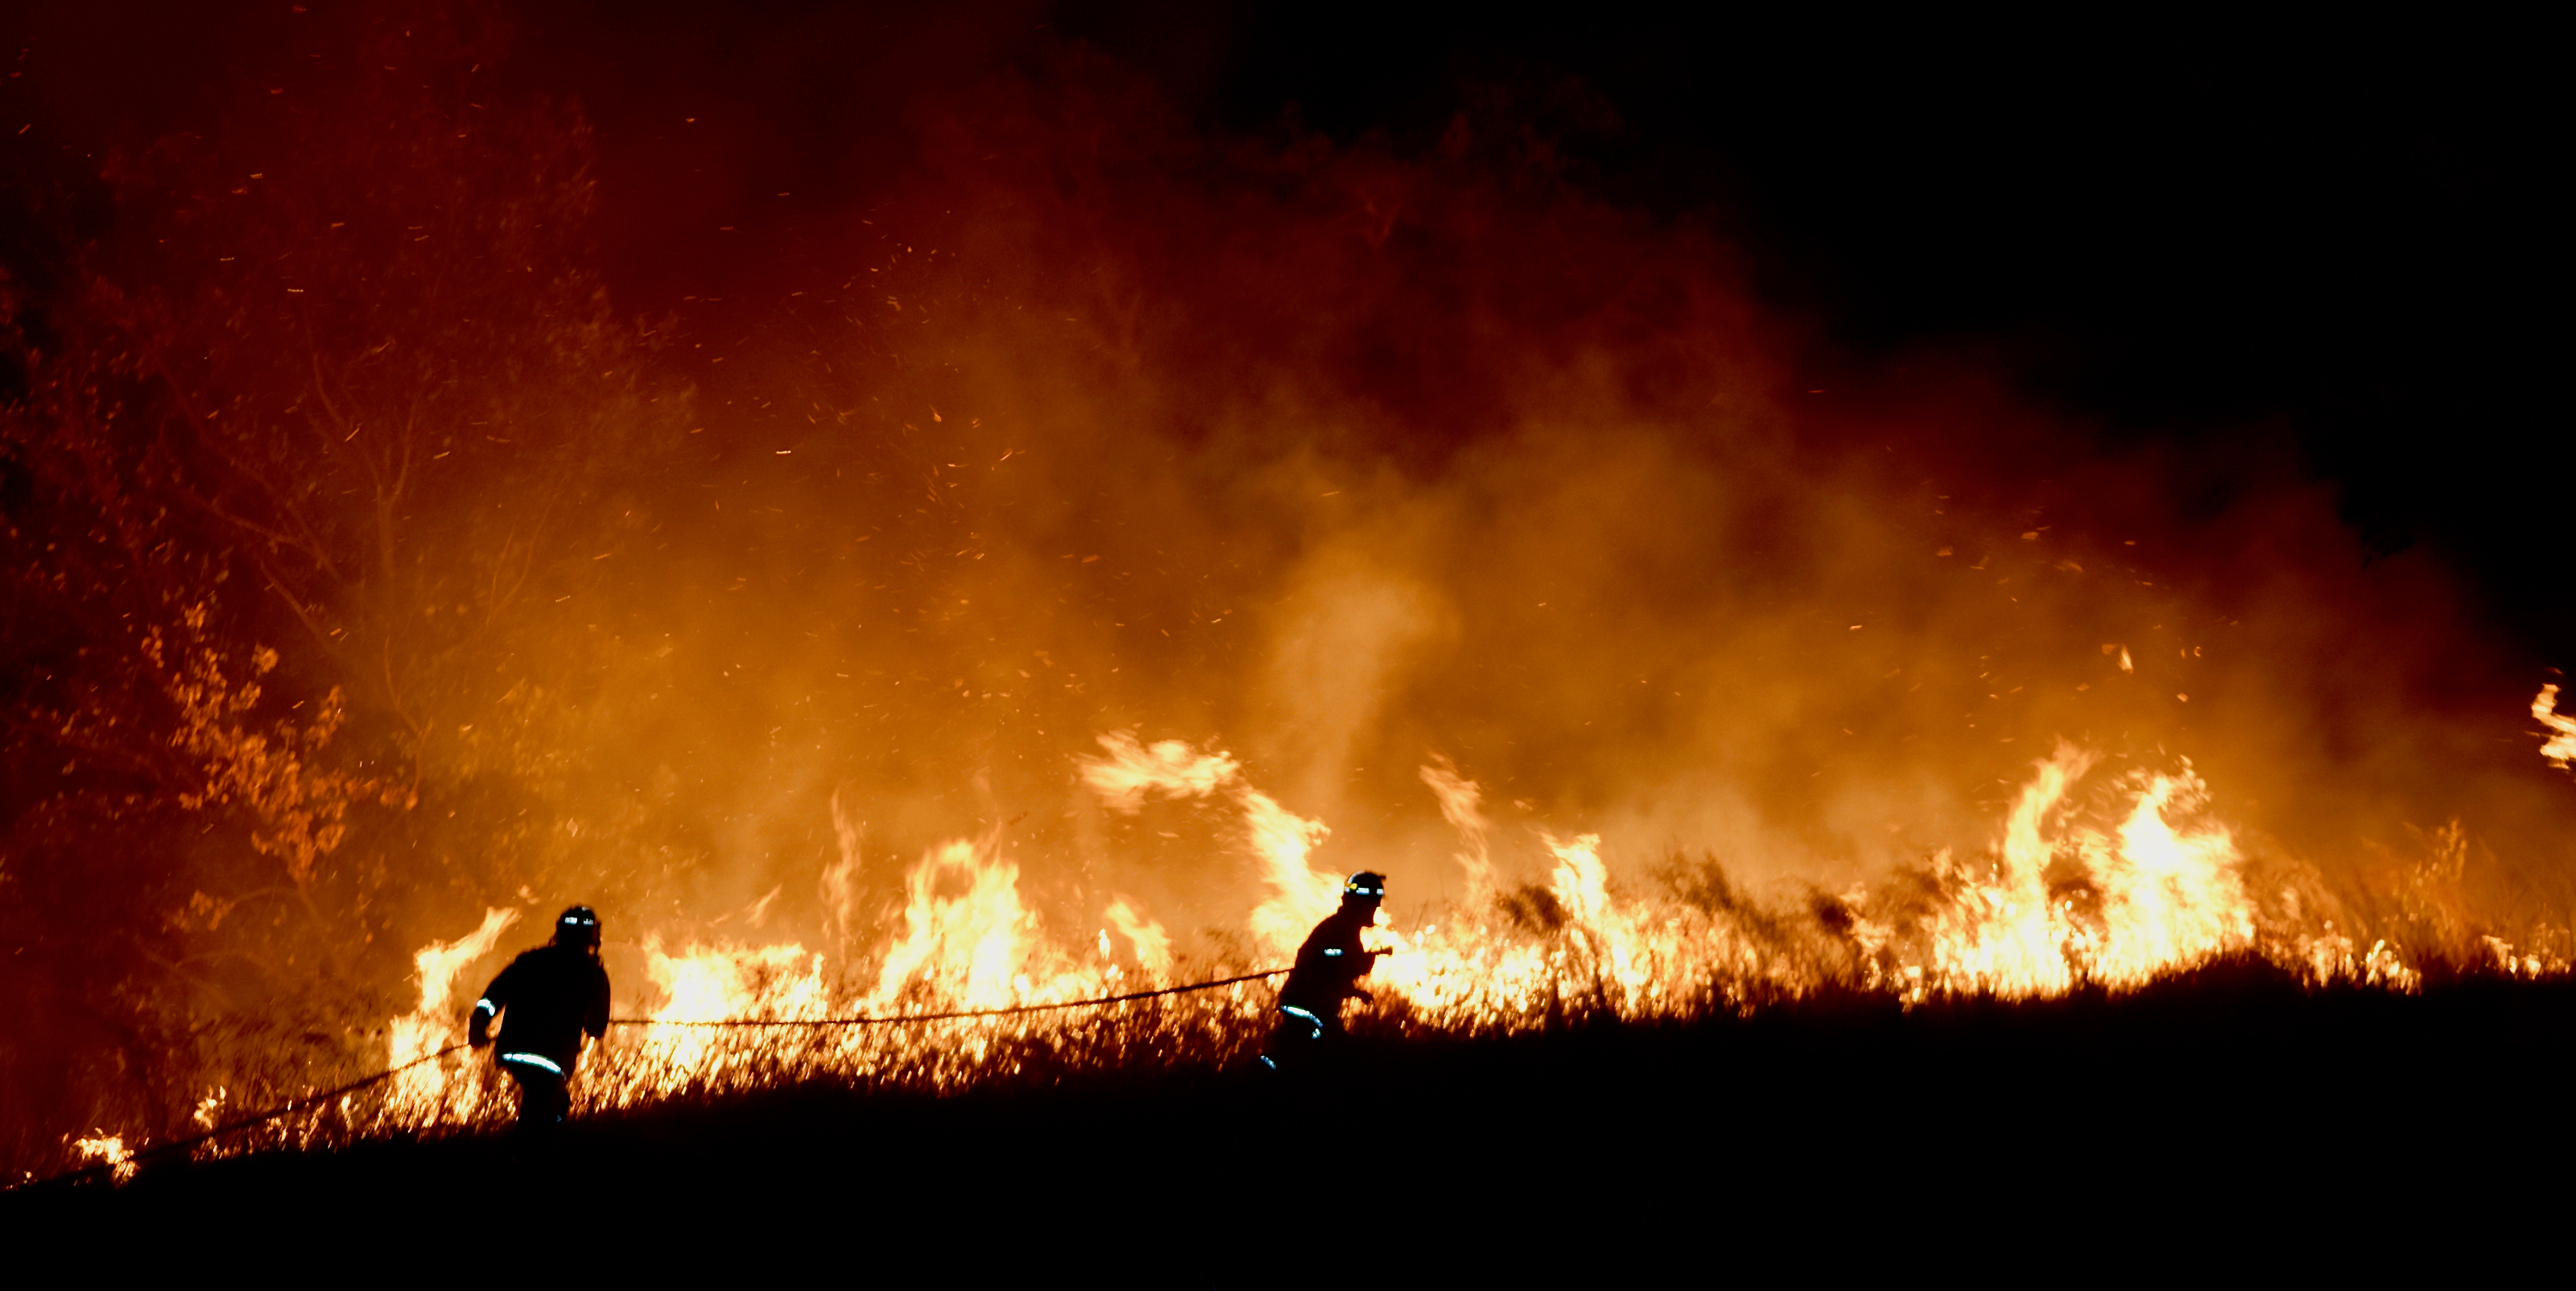
AUSVEG Advocacy: Bushfire Preparedness
16 November 2023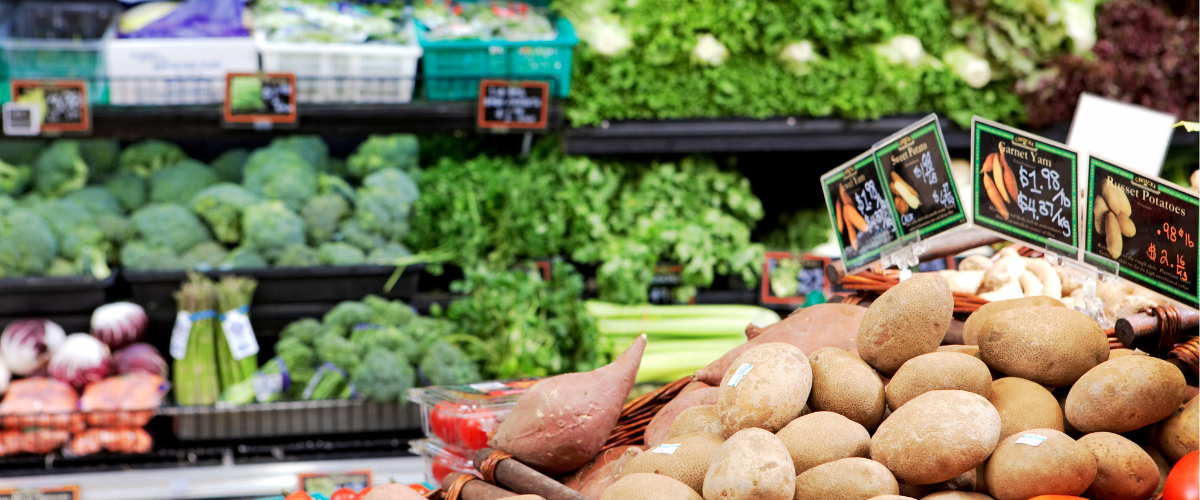
Input costs & trends
The last three to four months have seen something of a reversal to the relief growers enjoyed earlier in the year from declining input costs.
Diesel prices have jumped back up in the last three months to near their 2022 heights, while several fertilisers have started to drift northwards since bottoming out in July – albeit still at much lower levels than last year.
Average vegetable retail prices have increased marginally over the past four months, following seasonal trends and now tracking very closely to last year, with fluctuations in specific categories. Sales volumes have remained consistently down month on month, however.
Fertiliser
Global fertiliser prices have provided some relief for growers over the past year, with prices starting to stabilise after the astronomical increase we saw in 2021.
The relief has been short lived, however, with prices rising again as of September, the most significant being the cost of ammonia.
According to the International Food Policy Research Institute’s Food Security Portal, price movements for several fertiliser categories were influenced by the below inputs and require further monitoring:
- Ammonia prices surged in September due to major plant outages and buyers showing unusually strong interest during this normally quiet time of the year.
- Urea price increases over the past three months have been driven by uncertainty around Chinese export levels, as authorities have limited the distribution of export licenses to control domestic pricing. They’ve also been heavily impacted by the increased cost of natural gas – the main energy component required to produce urea. Australia has imported record levels of urea in 2023.
- Phosphorus fertiliser prices increased in several major markets due to uncertainty around export restrictions from China, linked to the customs inspection process.
- The global value of potash (MOP) is showing signs of stability.
Global fertiliser prices October 2022 – September 2023
Source: Food Security Portal, International Food Policy Research Institute

Chemicals
Taking a longer-term view on inputs, the cost of chemicals has shot up in the past few years due to global issues such as the Russia and Ukraine war, shipping delays escalated by COVID-19 protocols, and the progressive banning of agrichemical inputs by Australia’s trading partners.
According to an ABARES survey in 2022, 86% of Australian agricultural land managers spent an average of $22,000 on pest and weed management per year compared to 84% surveyed in 2019 who spent an average of $15,000.
Average cost of crop and pasture chemicals for cropping farms in Australia from financial year 2010 to 2022
Source: Statista.com

Diesel and energy
Since mid-year, the price of diesel has risen, almost reaching the record highs achieved in 2022. Prior to 2023, the ten-year average for diesel was almost 80 cents lower than it is today.
Whilst the price of diesel is high around the world, the effects on Australia are large as we have significant use in mining and agriculture.
Australia runs a risk of further increases in diesel costs due to the conflict in the Middle East, which could impact our access to crude oil, particularly if countries such as Lebanon and Iran become drawn into the conflict zone.
Iran is a member of the Organization of the Petroleum Exporting Countries (OPEC) and produces 3-4 million barrels of crude oil daily, which is almost five per cent of global supply. Twenty per cent of global crude oil must pass through the Persian Gulf, just south of Iran.
If the conflict enlarges, we may see an impact on energy markets with difficulties exporting crude oil from the region.
For a prediction of diesel prices, you can follow the Singapore Gasoil price, whose fluctuations Australian pricing closely follows with a lag of 1-2 weeks. The graph below shows Australian wholesale diesel prices (National Diesel TGP) against the Singapore wholesale price (Gasoil).
Australian wholesale diesel (TGP) vs Singapore diesel price (Gasoil)
Source: Australian Institute of Petroleum

Wages
As of 2022, OECD data indicates that Australia has the second-highest minimum wage in the world, after Luxembourg. From 2019 to 2021 it had the highest.
The National Minimum Wage (NMW) in Australia has risen at a steady average rate of 48 cents per year, growing from $15.00 per hour to $19.84 over ten years between 2010 and 2020.
However in the three years since then, it has jumped to an average increase rate of $1.13 per year (a 235% increase), now sitting at $23.23 per hour, as the Federal Government has faced pressure to keep the NMW rising in pace with inflation.
This input has compounded for growers due to other drastic changes to industrial relations laws since 2019, including:
- The minimum wage guarantee for pieceworkers
- Overtime and loading for casual workers
- Guaranteed 30 hours per week for PALM workers
National hourly minimum wage in Australia from 2010 to 2023
Source: Statista.com

Retail market data
The charts below show NielsenIQ Homescan data, provided through Hort Innovation’s levy-funded Consumer purchase and retail data (MT21004) program.
The data is presented in four-week periods.


For more information, contact AUSVEG National Public Affairs Manager Lucy Gregg at lucy.gregg@ausveg.com.au, or 03 9882 0277.